Are the years 1976 and 2002 identical for Gold?
Introduction: Gold in 1976 and 2002
In one of his recent interviews, well-known precious metals investor Rick Rule said that 1976 is similar to 2002. The main idea of the article is to investigate whether 1976 and 2002 are really identical.
First, we will show that 1976 and 2002 are the years before the big rally in the price of gold, but under different circumstances.
Then, we will show that in 1976 there was a negative real interest rate, and in 2002 an even more negative interest rate under the condition of an even larger deficit in GDP.
Finally, we will show that the stock market moved in opposite directions in 1976 and 2002.
1. 1976 and 2002 are the years preceding the gold price rally.
The price of gold in the 1970s was crazy with a sharp increase in the price of gold that was caused by two oil shocks. However, in 1976, in the period between the two oil shocks, the price of gold was 125US$ per ounce of gold, which is 23% lower than in 1976. However, this price drop was only a prelude to a sharp rise in the price of gold in the following years due to the second oil shock and the unstable political situation. At the end of 1970, the price of gold was 615US$ per ounce of gold.
In 2002, the price of gold was 285US$ per ounce, which was 6% higher than in 2001. However, the price of gold was still affected by the terrorist attack on September 9, 2001, as well as the sharp fall in the stock market in 2002. The situation continued to worsen due to the increase in debt. which led to the financial crisis in 2008-2009. The price of gold in 2009 was 857US$ per ounce of gold.
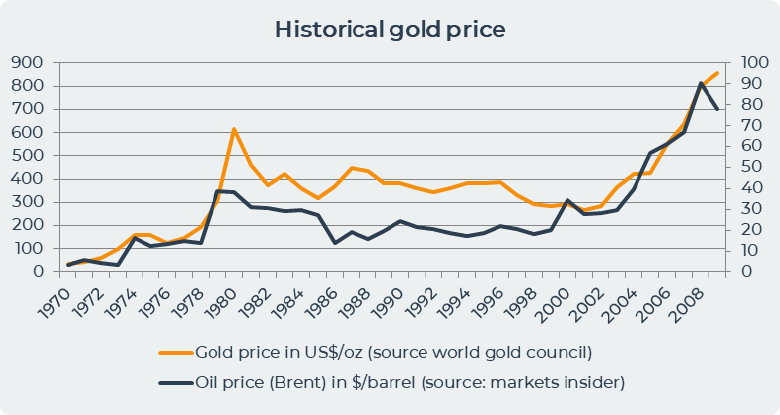
2. The Impact of Inflation on the Price of Gold in 1970s.
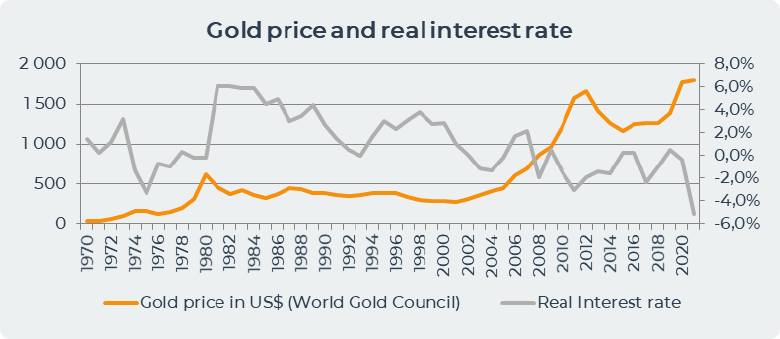
Inflation has a significant impact on the price of gold. We will study inflation through real interest rates. Real interest rates are inflation minus the risk-free rate paid by the Central Banks. In the chart below, we see that real interest rates fall to negative value after the oil shock of 1973 and the great inflation in the USA. In 1976, inflation was 5.8%. The Fed remained below the curve until the 1980s when the price of gold corrected. The 1970s saw a massive 2300% increase in the value of gold in a decade from 35US$ per ounce in 1971 to 850US$ per ounce in the late 1970s.
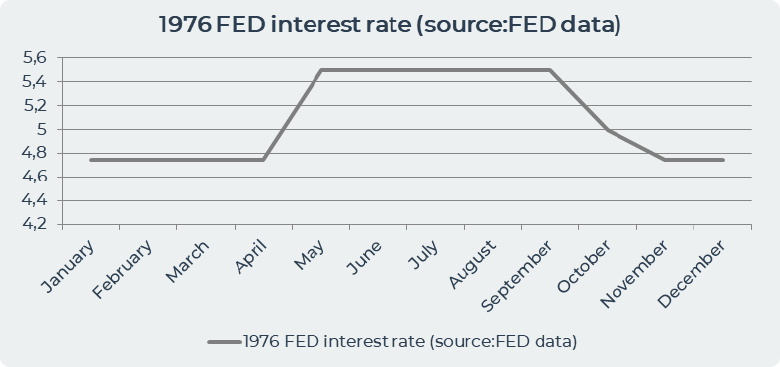
In the 1970s, the Fed printed a lot of money and raised interest rates to fight inflation. In 1976 the Fed continued to raise its interest rates to 5.5% and began lowering its interest rates when the gold standard ended in October 1976.
The combination of a negative real interest rate and a negative trade balance creates a bull market for gold. The chart below shows that in 1976, the Deficit-to-GDP ratio was negative -0.1% and the real interest rate was also negative -0.7%. The combination of these factors led to an increase in the price of gold in 1976 by 23% compared to 1976. So investors lost their money in 1976.
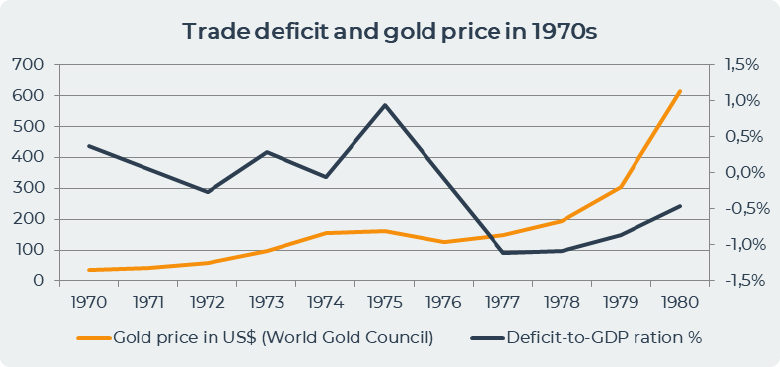
In the 70's, as we can see in the chart above, gold prices began to take off not when the inflation arose in 1973, but when the trade deficits began to drop sharply in 1977.
This combination took place in the period 1976-1977. At that time there was a significant drop of the trade deficit compared to the previous decade and negative real interest rates. The trade deficit was only -1%, but this situation was new for the USA, since in the previous decade they had a positive trade balance. The result of this combination was a 4-fold increase in the price of gold from US$154 in 1974 to US$615 at the end of the 1970s.
2b. 2002, Again a Negative Real Rate but a Much Larger Trade Deficit.
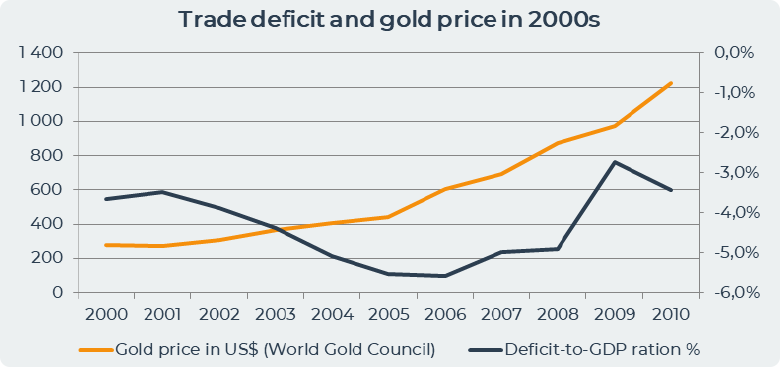
In 2002, the inflation rate was 1.6%, which was the beginning of a sharp increase in inflation in the following years and an increase in the price of gold. The price of gold in 2002 was $310 per ounce of gold, which is 15% more than in 2001. In the 2000s, there was also an oil and a big financial crisis and the price of gold increased more than 4 times from 279US$ per ounce of gold in 2000 to 1225US$ per ounce of gold in 2010.
The chart below shows that the increase in the trade deficit in the early 2000s led to a sharp rise in the price of gold. A trade deficit increased by 2% in the period from 2001 to 2005, from -3.5% to -5.5%, which, in combination with negative real interest rates in the period from 2003 to 2005, led to a sharp increase in the price of gold by 64%.
In 2002, the Fed lowered its interest rate, explaining that it was concerned about the recovery of the economy against the background of a possible war in Iraq, which would affect consumer and business confidence. By lowering rates in 2002, the Fed hoped to motivate consumers to spend more and businesses to increase investment, which would contribute to economic growth. In an October 2002 statement, the Fed said, "Today's additional monetary easing should prove helpful as the economy works its way through this current soft spot."
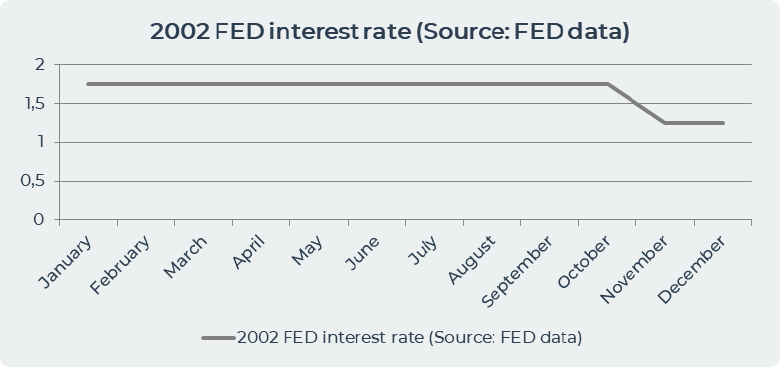
The chart above shows that the Fed interest rate was stable in 2002 and was cut in October by 50 basis points from 1.75 to 1.25 to fight sluggish growth.
3. Stock Market and Unemployment in 1976 and 2002.
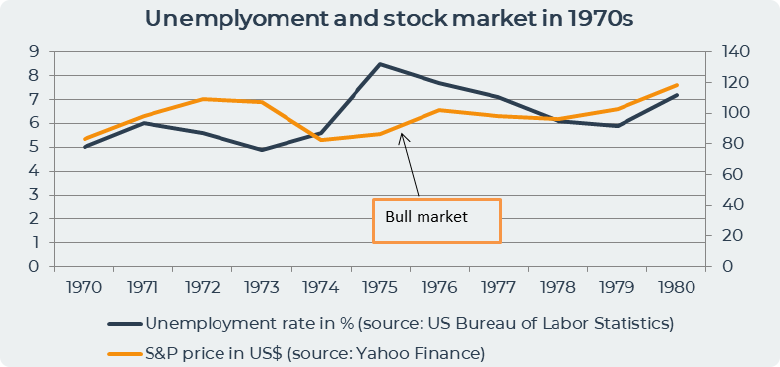
In 1976-1976 there was a bull market that started several decades of market growth. During this period, the price of S&P grew by 23% from 83 dollars in 1974 to 102 dollars in 1976. This period is characterized by the recovery of the market after the collapse of the stock market in 1973-1974, which happened after the collapse of the Bretton Woods system and the Nixon shock.
Against the background of economic recovery, the unemployment rate in 1976 was 7.7%, which was 0.8% lower than in 1976, but in 1976 there was a sharp increase in unemployment by 3% compared to 1974. The mid-1970s also saw highly publicized labor disputes. For example, in 1976, 80,000 workers in Pennsylvania organized the first legal strike in the state. In the chart below, we can see that unemployment continued to decline until the end of the 1970s until it began to rise again in the 1980s.
3b. The Collapse of the Stock Market in the Early 2000s and the Rise of Unemployment
In 2001, there was a sharp decline in the stock market after the terrorist attack on September 9, 2001. After the terrorist attack, major indicators slowly recovered until March 2002 before collapsing sharply in July and August 2002. According to a report by the Federal Reserve, this decline can be seen as part of a larger bear market or a correction that began in 2000 after a decade-long bull market led to extremely high share prices. An example is the collapse of Enron. Many Internet companies (Webvan, Exodus Communications and Pets.com) went bankrupt. The emergence of accounting scandals such as Arthur Andersen, Adelphia, Enron and WorldCom was also a factor in the speed of the decline, as numerous large corporations were forced to restatement of earnings and investor confidence suffered. Moreover, the International Monetary Fund expressed concern about volatility in the United States' stock markets in the months before the sharp decline.
In 2001-2003, the S&P 500 declined in value by 33% from 1427US$ to 965US$ in 2003. By the end of the stock market downturn of 2002, stocks had lost $5 trillion in market capitalization since the peak. The S&P 500 lost 50% to reach the October 2002 lows.
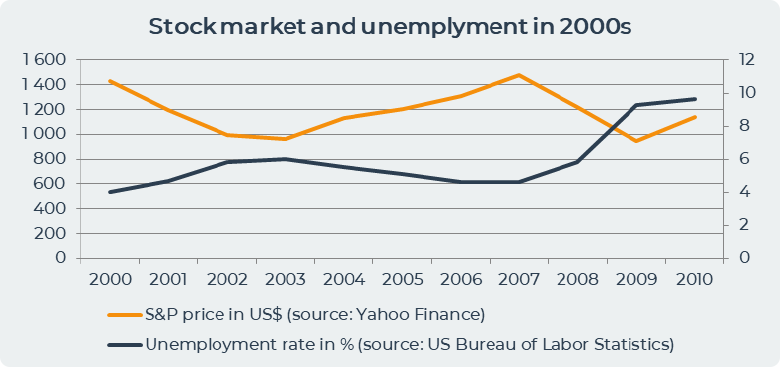
The unemployment rate in 2002 was 5.8%, which is 1.1% more than in 2001. The Bureau of Labor Statistics in its report indicates that the labor market remained weak in 2002. The weakness of the labor market is due to the “uncertainty” faced by businesses and consumers. In the first half, there was a slight improvement due to “the rise of industrial production and the growth of consumer confidence,” but in the second half the situation worsened due to “geopolitical risks and scandals related to the violation of accounting rules.”
Conclusion
Rick Rule talked about 1976 and 2002 being identical for gold. However, we can see what is wrong. We see different situations in stock markets and unemployment. In 1976, the stock market was recovering from a crash, and in 2002, the stock market crashed. The real interest rate and the trade deficit are definitely the reason for the rise in the price of gold, but it is necessary to note the conditions under which these events took place. In 1976-1976, for the first time, a combination of these factors led to a bull market in gold. In the 2000s, the situation was repeated, but there was a much larger trade deficit.
Date= 9th December 2022, Gold price – 1808.80$, Silver price – 23.52$, Platinum price – 1024.70$, Oil price – 71.69$


