


Explore average and marginal production costs from 2023 to 2025, our break-even methodology, and the factors shaping the economics of global silver supply.
1. Silver Production Costs: The Results
The silver market is often discussed in terms of its spot price, but the cost of producing silver is equally important for understanding long-term supply, investment risk, and the economics of the mining industry.
Based on our analysis of ten major and mid-sized silver-producing companies, we estimated both an average production cost and a marginal production cost for silver for the years 2023, 2024 and 2025.
| Year | Average Production Cost | Marginal Production Cost |
|---|---|---|
| 2023 | USD 24/oz | USD 32/oz |
| 2024 | USD 27/oz | USD 34/oz |
| 2025 | USD 29/oz | USD 56/oz |
The distinction between these two figures is important.
The average production cost provides an indication of the general cost level at which silver is produced across the industry. The marginal production cost, on the other hand, represents the cost level of the higher-cost producers that are still operating.
The evolution between 2023 and 2025 is particularly significant. Average production costs increased progressively, from approximately USD 24/oz in 2023 to USD 29/oz in 2025. Marginal costs increased much more sharply, reaching approximately USD 56/oz in 2025.
This suggests that while a large part of the industry can still produce silver at considerably lower prices, some producers require much higher silver prices to remain economically viable.
2. Methodology: How We Estimated the Production Cost of Silver
Estimating the true production cost of silver is more complicated than simply taking the reported mining cost of one company.
Silver producers have very different mining operations and accounting structures. More importantly, many silver mining companies do not produce silver alone. Their mines can simultaneously generate gold, lead, zinc and copper.
For this reason, our methodology estimates the silver price at which each company would approximately reach its economic break-even point, while taking into account the value of its other metals.
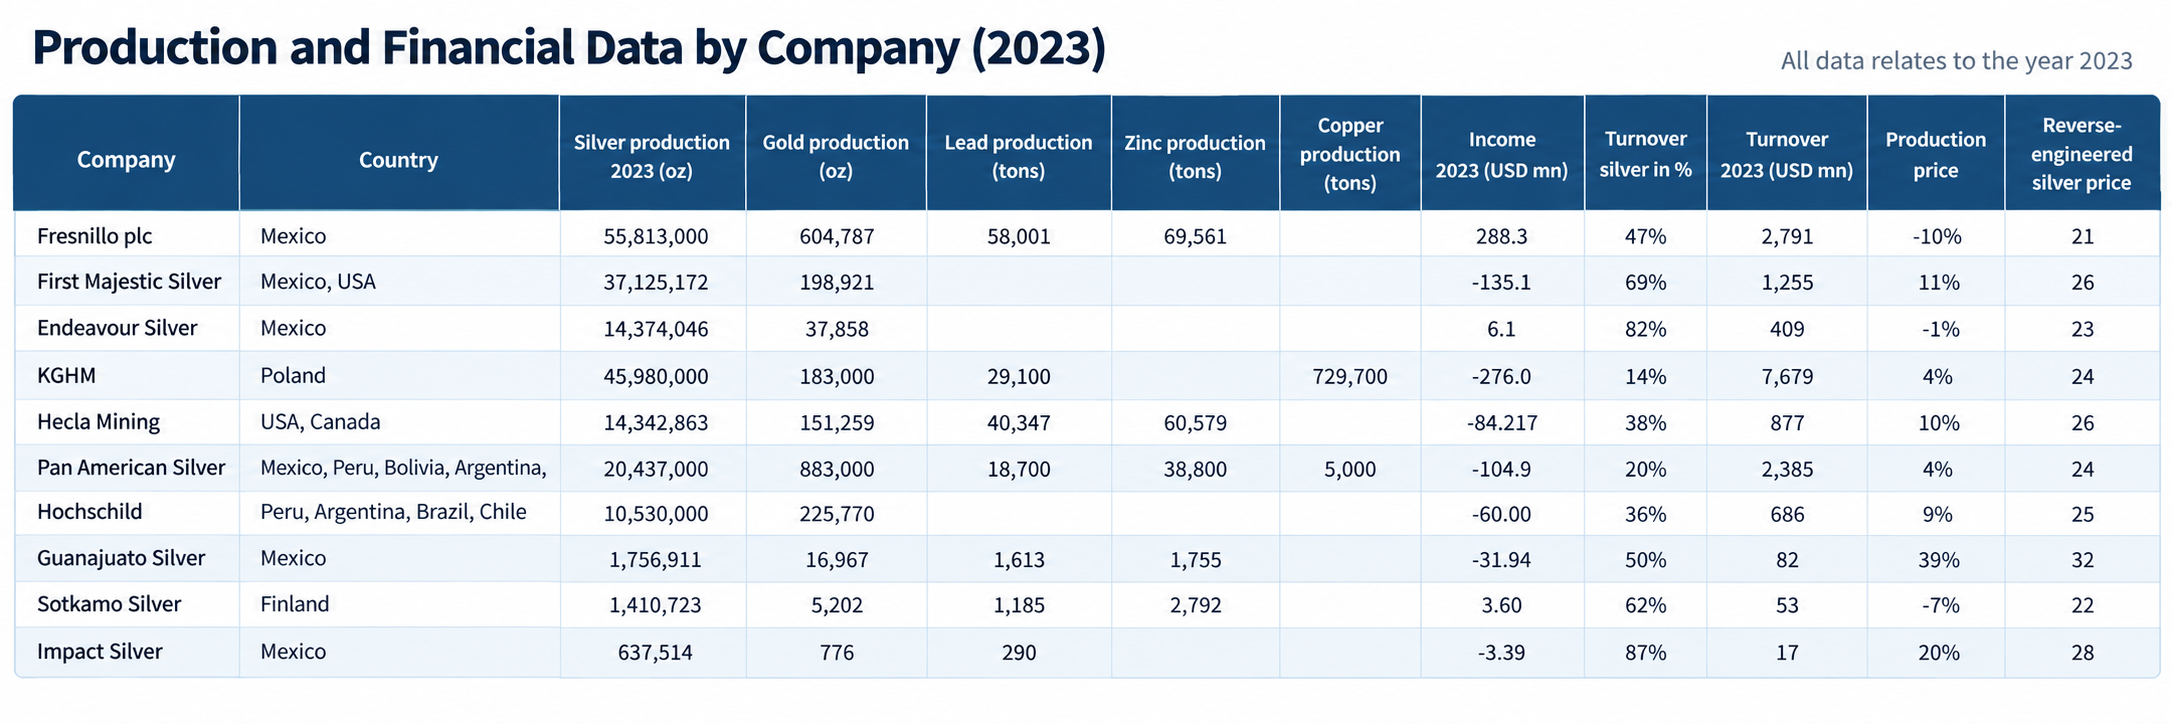
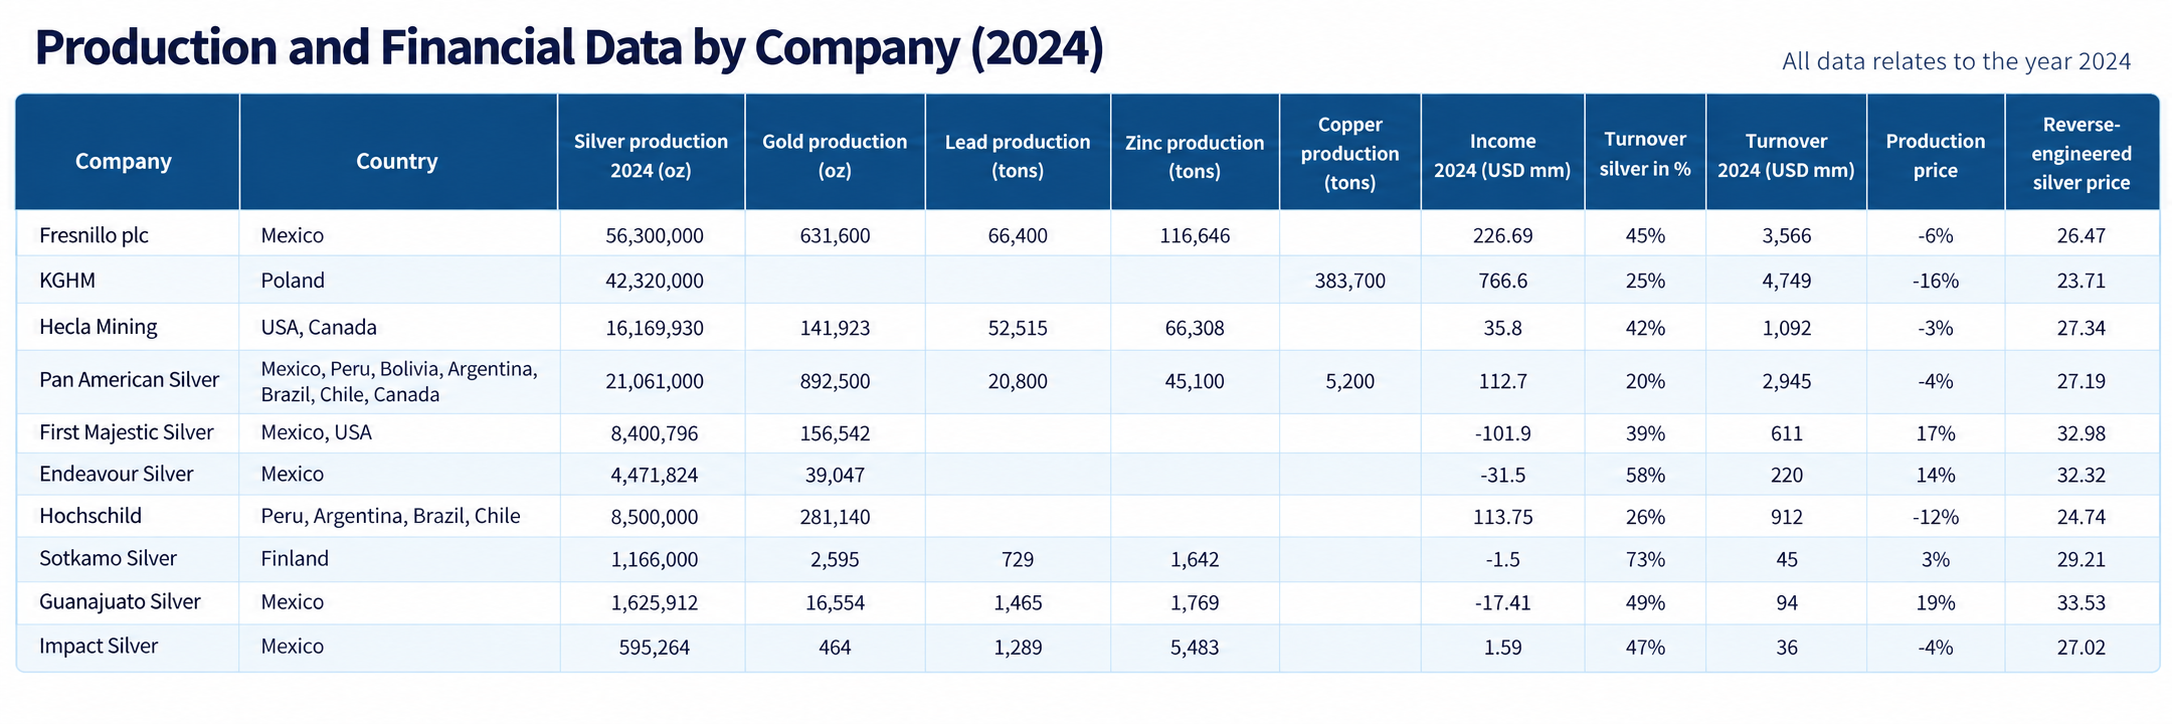
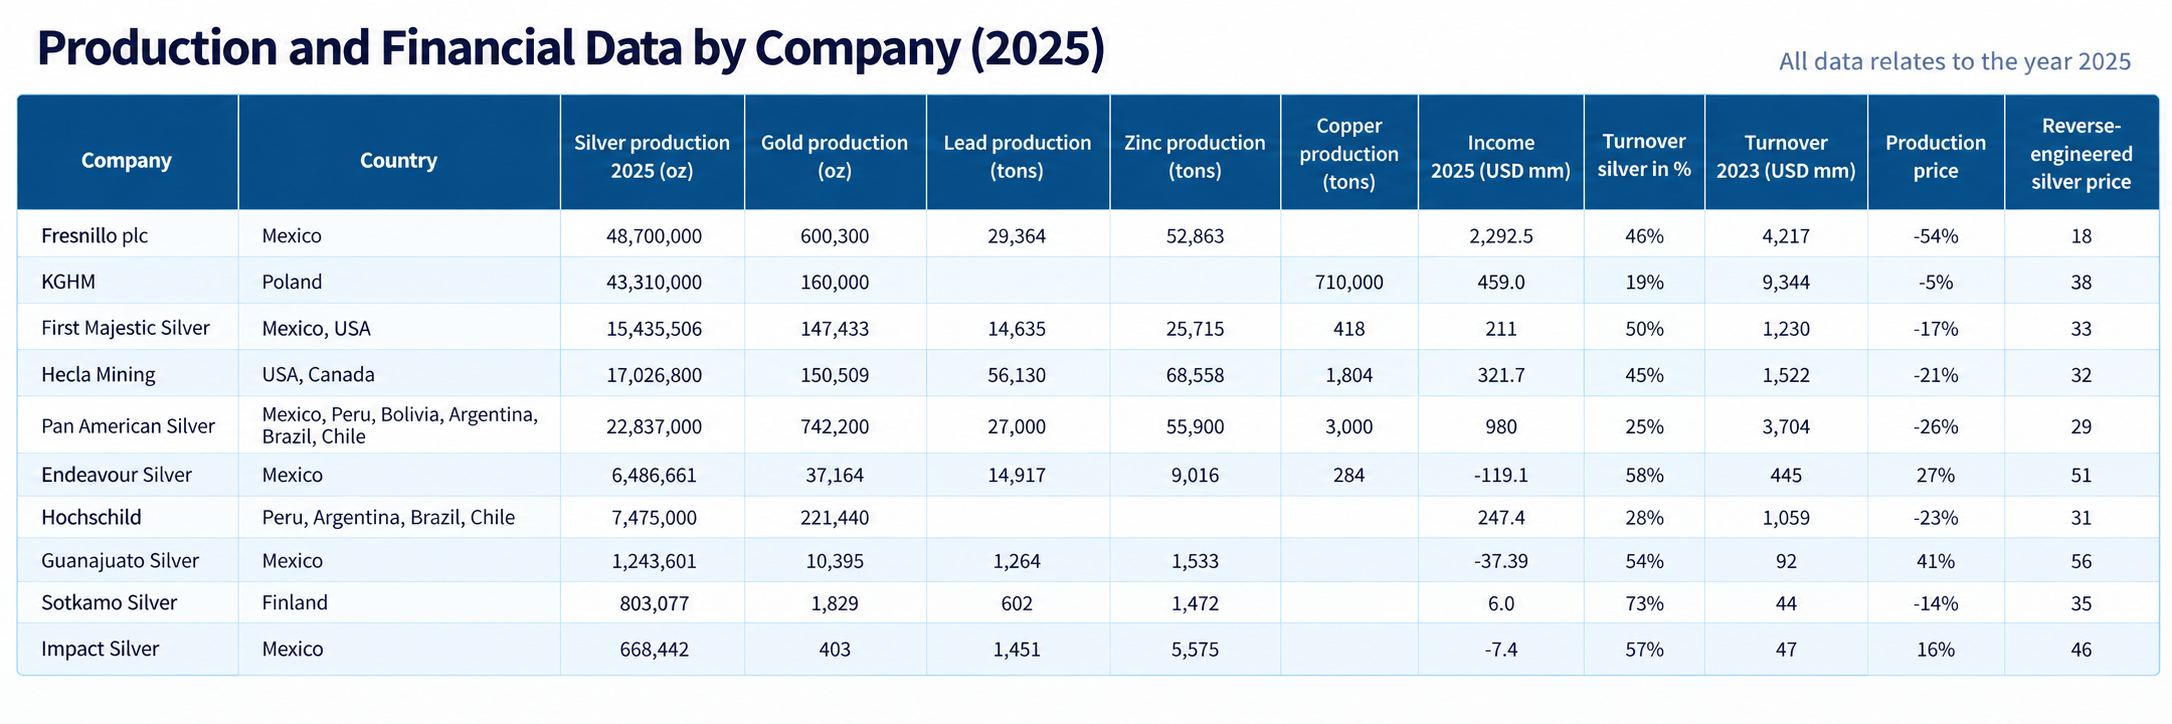
Companies Included in the Analysis
The analysis covers ten publicly reported silver producers operating across several major mining jurisdictions:
- Fresnillo plc
- Hecla Mining
- First Majestic Silver
- Endeavour Silver
- Pan American Silver
- IMPACT Silver
- Guanajuato Silver
- Hochschild Mining
- KGHM
- Sotkamo Silver
Using the same group across the analysed period allows us to observe how the economics of silver production evolved between 2023 and 2025.
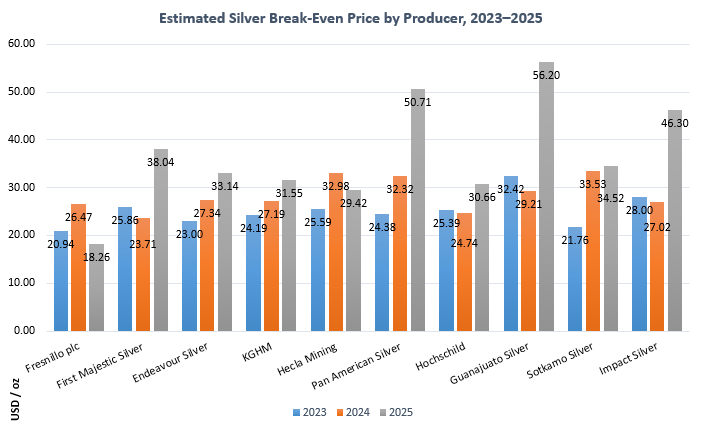
The companies are deliberately diverse. They include some of the world's largest silver producers as well as smaller producers with considerably different production volumes and cost structures. This is important because marginal production economics cannot be understood by examining only the industry's largest and most efficient mines.
Step 1 – Measuring the Production of Each Metal
For each company and each year, we collected reported production volumes for:
Silver, gold, lead, zinc and copper.
Silver and gold production were measured in ounces, while lead, zinc and copper production were measured in tonnes.
The model therefore does not assume that all of a mining company's economics depend on silver.
This is particularly important because a company producing silver together with large quantities of gold, zinc or copper may remain profitable even when the silver price itself is relatively low.
Step 2 – Applying Annual Metal Prices
For every year, production volumes were valued using the corresponding metal prices used in our model.
For example, the 2024 calculation used:
- Silver: USD 28.27/oz
- Gold: USD 2,388/oz
- Lead: USD 2,058/tonne
- Zinc: USD 2,828/tonne
- Copper: USD 9,260/tonne
For each company, we multiplied its production of each metal by the corresponding metal price.
In simplified form:
Estimated metal turnover = Silver production × Silver price + Gold production × Gold price + Lead production × Lead price + Zinc production × Zinc price + Copper production × Copper price
This produces an estimated total value of the metals produced by each company.
Step 3 – Determining Silver's Share of Production Value
We then calculated how much of each company's estimated metal turnover was attributable specifically to silver.
The calculation is:
Silver share = (Silver production × Silver price) / Estimated total metal turnover
This is a particularly important part of the methodology.
For a company primarily dependent on silver, silver represents a large proportion of the estimated production value. For a diversified producer with substantial copper or gold production, the proportion attributable to silver can be considerably smaller.
For example, in the model, silver represented approximately 45% of Fresnillo's estimated metal turnover in 2024, compared with approximately 25% for KGHM.
This prevents the analysis from treating a diversified producer in the same way as a predominantly silver-focused producer.
Step 4 – Estimating the Break-Even Adjustment
The next step is based on a simple economic assumption:
A mining company can continue operating as long as its overall operations remain economically viable.
For each producer, we compared its reported annual income with the estimated value of its metal production.
The model calculates the percentage movement in metal prices that would theoretically eliminate the company's reported income and bring it approximately to break-even.
The adjustment is calculated as:
Break-even adjustment = – Reported income / Estimated metal turnover
A profitable company can therefore tolerate a reduction in metal prices before reaching break-even.
Conversely, if a company is already reporting a loss, the calculation produces a positive adjustment: metal prices would need to increase for the company to reach the estimated break-even level.
Step 5 – Applying the Adjustment to Silver
The calculated break-even percentage is then applied to the silver price for the corresponding year.
The formula is:
Estimated silver production price = Silver price × (1 + Break-even adjustment)
This provides an estimated silver price associated with the economic break-even point of each producer.
As an illustration, the silver price used in the 2024 model was USD 28.27/oz.
For Fresnillo, the model calculated a break-even adjustment of approximately –6.4%, producing an estimated silver production price of approximately USD 26.47/oz.
For First Majestic, which reported a loss in the dataset used for the calculation, the adjustment was approximately +16.7%, resulting in an estimated production price of approximately USD 32.98/oz.
The methodology therefore captures the very different economics of individual producers rather than assigning the same production cost to the entire industry.
Step 6 – Weighting Producers by Silver Production
A simple arithmetic average of the ten companies would give a small producer the same importance as a company producing tens of millions of ounces of silver.
To avoid this distortion, the calculation incorporates silver production volumes when aggregating the company-level results.
In other words, producers with larger silver output have a greater influence on the estimated industry production cost than very small producers.
This allows the resulting figure to better represent the economics of the analysed silver production rather than merely the average of ten companies.
Step 7 – Estimating the Marginal Production Cost
Finally, we examine the higher-cost producers in the sample.
This is where the marginal production cost becomes particularly useful.
The marginal cost is not intended to describe what the majority of silver costs to produce. Instead, it indicates the approximate price level required by the higher-cost part of production to remain economically sustainable.
This explains why the marginal cost can move much more dramatically than the average.
In 2025, for example, the model estimated approximately USD 56.20/oz for Guanajuato Silver, while Endeavour Silver was estimated at approximately USD 50.71/oz. At the same time, several larger producers remained substantially below these levels.
The resulting distribution therefore shows a widening gap between efficient producers and the highest-cost producers.
What the Methodology Tells Us
This methodology should not be interpreted as the accounting cost of extracting one physical ounce of silver from a particular mine.
Instead, it is an economic break-even model designed to estimate the silver price levels compatible with the financial sustainability of different producers.
This distinction matters because silver is frequently produced together with other metals. Looking only at a company's reported silver cash cost or AISC can therefore provide an incomplete picture when comparing producers with very different by-product exposure.
By combining production volumes, metal prices, the relative contribution of silver and company profitability, the model provides another way of examining the economic foundations of global silver supply.
The results show that the industry's average production economics have deteriorated progressively since 2023, while the economics of marginal producers have deteriorated much more rapidly.
This widening difference between average and marginal production costs is important for the silver market: if prices remain below the economic requirements of marginal producers for an extended period, higher-cost production is the part of supply most exposed to reductions, closures or delayed investment.