In 2023, the production of gold, silver, and platinum revealed distinct cost structures and profitability trends driven by geological, operational, and geopolitical factors.
Introduction
In this article, we explore the 2023 production costs, production volumes, and profitability for the world’s leading mine of gold, silver, and platinum. The analysis is organized into the following sections:
- In the first section, we examine gold production, sustainable costs, production volumes and net profits/losses for the world's leading gold producers.
- In the second part, we will analyze Silver Production, its cost ranges, production volumes and the profitability of the leading silver producers.
- In the third part, we study the Platinum production, which highlights the concentration of platinum output, disclosed costs, and notable profit or loss figures.
- We then summarize the differences in cost levels, production volumes and general profitability trends for the three precious metals.
- And finally, we'll describe the common factors influencing production costs, including geography, operational efficiency and market prices.
1. Gold Production: High Costs, Variable Profitability
Gold has enjoyed a reputation as one of the most demanded and valuable metals in the world, often considered a hedge against inflation and economic uncertainties. Its significance in jewelry, and as a traditional safe-haven asset perpetuates a robust and liquid global market. Even so, gold mining is among the costliest activities in the precious metals sector, largely due to the geological complexity of gold deposits, the capital-intensive nature of exploration, and the depth at which many gold ores are located.
Below is a simplified table of gold production data for 2023, showing each company’s country of origin, annual output, sustainable costs, and reported profit or loss. While there are numerous producers, we will focus on the five largest companies to illustrate the range of cost structures and profitability.

(sources from Companies annual reports 2023)
From this table, we see a wide range of sustainable costs (also referred to as all-in sustaining costs, AISC), from roughly $1,179 to $1,538 per ounce. Such differences can result from diverse ore grades, mine depths, labor costs, infrastructure requirements, and geographic challenges. Even producers with relatively high per-ounce costs can remain profitable if market prices remain high or if they possess operational advantages elsewhere. Gold’s price has fluctuated around $1,800–$1,900 per ounce in 2023, providing a cushion for many producers, though not all companies necessarily benefit equally.
1.1 Highlights on Most Interesting Gold Miners
-
AngloGold Ashanti (South Africa)
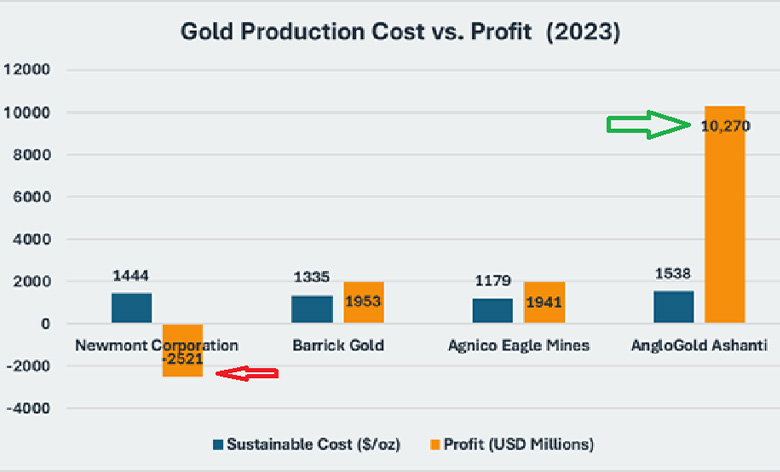
Among the gold producers listed, AngloGold Ashanti stands out for having the highest reported sustainable cost at $1,538 per ounce as displayed in the chart below. Under normal circumstances, such a high cost would pose a serious challenge to maintaining healthy margins. Nevertheless, as displayed in the chart, AngloGold reported a substantial profit of $1.03 billion, highlighting that a high gold price or other business benefits—such as currency exchange rates and well-managed overhead—can offset high operating costs. South African operations often face energy supply issues and deep-level mining complexities, yet AngloGold’s scale and long history in the region enable it to meet these challenges effectively.
-
Newmont Corporation (USA)
Newmont is notable for two reasons: it is one of the world’s largest gold producers by volume (5.50 million ounces in 2023), yet it posted a net loss of -$2.52 million as highlighted in the chart below. High capital expenditures, potential project overruns, and the operational costs spread across multiple mines around the world may explain why higher production volume did not result in a positive net result. This scenario highlights that even with robust production, a combination of cost inflation, expensive exploration programs, and potentially lower sales prices during certain periods can impact profitability.
(sources from Companies annual reports 2023)
1.2 Broader Trends in Gold Mining
-
Cost Pressures from Inflation
Rising energy, labor, and equipment costs have increased gold production costs. In addition, stricter environmental regulations can compel companies to invest more capital in water management, tailings dam safety, and emissions reductions. -
Geographic Complexity
Many gold deposits are located in politically or logistically challenging regions. While some companies benefit from stable jurisdictions (e.g., Canada, the United States), others operate in areas with power instability, labor disputes, or high-altitude environments that increase operational expenditures. -
Divergent Strategies
Some of the world’s leading gold miners, especially those with high profitability, focus on high-grade ore bodies and use advanced technologies to optimize extraction. Others, pursuing a strategy of scale, operate numerous mines across continents. Such diversification can mitigate risks but also increase overall cost if underperforming assets drag down profits.
2. Silver Production: Lower Costs, Volatile Margins
Silver is frequently eclipsed by gold, yet it remains essential not only as a precious metal but also as an industrial commodity. Its applications include electronics, photovoltaic solar cells, medical devices (due to its antibacterial properties), and various industrial catalysts. This dual role creates a unique dynamic: while gold prices are often driven by investment demand, silver’s price can be more volatile due to fluctuations in manufacturing output and technological trends.
Below is a 2023 dataset showing companies’ reported silver production volumes, sustainable costs (sources from Companies annual reports 2023), and profit or loss figures:

Where disclosed, the sustainable cost (akin to all-in sustaining cost) ranges from a low of about $11.76 per ounce to a high of $20.40 per ounce. This range is significantly lower in nominal terms than that of gold, but it must be considered alongside silver’s much lower prevailing market price, generally oscillating in the $20–$25 per ounce range.
2.1 Highlights on Most Interesting Silver Miners
-
Fresnillo (Mexico)
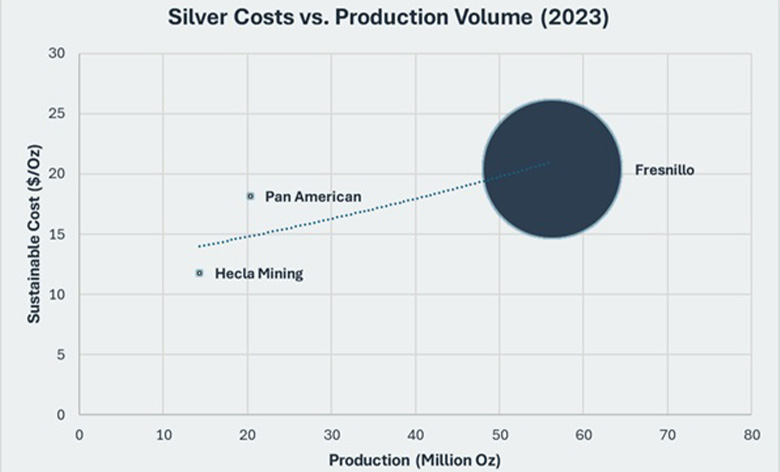
Among the silver miners, as displayed in the chart below, Fresnillo deserves attention for its relatively high reported cost of $20.40 per ounce . Nevertheless, the company posted an impressive $288.3 million profit thanks to producing over 56 million ounces of silver. Even if margins per ounce are not exceptionally high, sheer volume can lead to substantial results. Mexico’s famed silver belts and Fresnillo’s expertise in large-scale operations have historically made it a globally dominant silver producer.
-
Polymetal International (Russia)
Polymetal International did not disclose a specific sustainable cost, likely reflecting the reality that silver is often mined alongside gold in a mixed portfolio. However, the company’s strong profit of $528 million showcases the benefit of combining multiple precious metals. Such diversification can provide revenue buffers if one metal underperforms in the market.
(sources from Companies annual reports 2023)
2.3 Volatility and Byproduct Nature
Silver’s cost structure is often influenced by whether it is the primary metal or a byproduct of base metals like lead, zinc, or copper. Some mining companies effectively “credit” the revenues from base metals against silver production costs, drastically lowering their reported sustainable cost for silver. This can create misleading comparisons among companies, as those with genuine primary silver mines may not benefit the same byproduct credits.
Furthermore, silver’s industrial dependency can make margins vulnerable to macroeconomic fluctuations. A slowdown in manufacturing can reduce silver demand, leading to price drops and margin compression for miners—especially those without a substantial byproduct cushion. Conversely, technological booms—such as rising solar panel adoption—can temporarily boost demand and prices, lifting profits for producers.
3. Platinum Production: Moderate Costs, Geopolitical Concentration
Platinum occupies a crucial niche in the global economy. Although prized for jewelry, the metal’s largest demand comes from industrial uses, notably automotive catalytic converters. This dependency on industrial applications can make platinum prices sensitive to changes in vehicle manufacturing trends. Furthermore, platinum supply is dominated by South Africa and Russia, rendering it especially vulnerable to local labor strikes, power outages, and geopolitical developments.
Here is a table showing selected platinum production data for 2023:

(sources from Companies annual reports 2023)
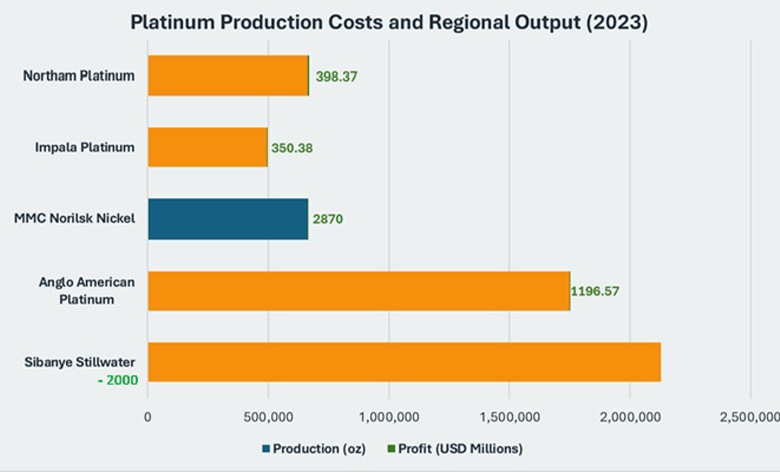
Among the companies reporting data, sustainable costs cluster around $1,050 to $1,150 per ounce. In nominal terms, these costs can be close to those for gold, but actual profitability depends on the platinum market price, which historically can be lower than gold. South Africa, highlighted in yellow in the chart below, dominates this list, reflecting the country’s massive platinum reserves. MMC Norilsk Nickel in Russia represents another key source, producing platinum (and other platinum-group metals) as part of a diversified mining portfolio that includes nickel, palladium, and copper.
3.1 Highlights on Most Interesting Platinum Producers
-
Sibanye Stillwater (South Africa)
One of the largest platinum producers by volume at 2.13 million ounces, Sibanye has disclosed an AISC of $1,050 per ounce—making it one of the lower-cost producers in the dataset. Despite that, Sibanye reported a staggering net loss of -$2.0 billion as displayed in green in the chart below, demonstrating how operational or financial setbacks (like industrial disputes, power disruptions, or significant asset write-downs) can outweigh even a competitive cost structure. This example shows that cost per ounce alone does not guarantee profitability if external or internal factors disrupt results.
-
MMC Norilsk Nickel (Russia)
While MMC Norilsk Nickel did not break out a specific sustainable cost figure for platinum, it posted a massive $2.87 billion profit across its mining portfolio as displayed in the chart below. This starkly demonstrates the advantages of diversification: revenues from nickel, palladium, copper, or other metals can buoy overall profits even if platinum margins are subject to cyclical downturns.
(sources from Companies annual reports 2023)
3.2 Geopolitical and Operational Factors
South African platinum miners often operate some of the deepest mines in the world, facing high labor expenses, intermittent strikes, and electricity supply issues from the national utility. Moreover, currency fluctuations (the South African rand against the U.S. dollar) can significantly influence reported costs in dollar terms. A weaker rand can lower costs from a dollar perspective, but any local inflation or wage hikes can quickly erode that advantage.
In Russia, political dynamics and sanctions can disrupt supply chains or curtail exports, thereby impacting production and profitability. However, when operations run smoothly, large Russian producers like MMC Norilsk Nickel capitalize on economies of scale and integrated smelting/refining facilities.
4. Key Comparisons
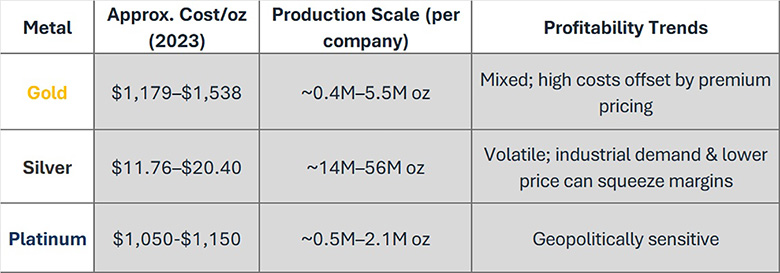
Below is a simplified comparison of the three metals in terms of approximate costs, typical per-company production scale, and common profitability trends for 2023:
(sources from Companies annual reports 2023)
4.1 Cost Per Ounce and Market Prices
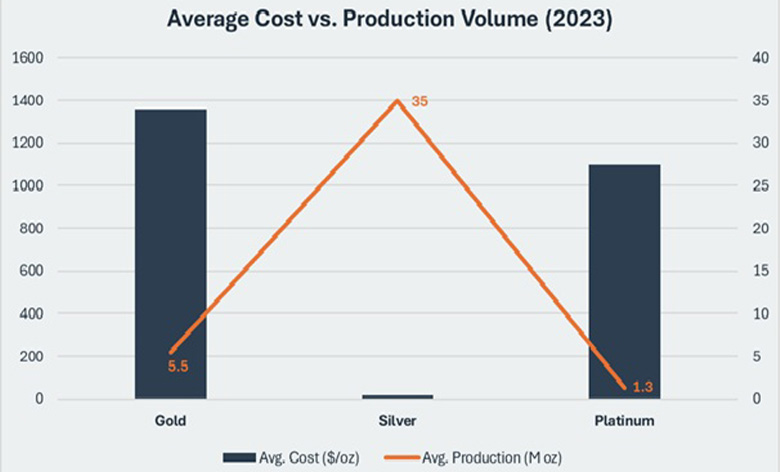
Gold production costs vary notably across operations. For example, low-cost producers like Agnico Eagle Mines in Canada report sustainable costs as low as $1,179 per ounce, while higher-cost operators such as AngloGold Ashanti in South Africa incur costs up to $1,538 per ounce. Despite this variation, strong market demand has kept gold prices averaging between $1,800 and $1,900 per ounce in 2023, allowing many producers to maintain profitability even at higher cost levels.
In contrast, platinum’s reported sustainable costs fall within a narrower range of about $1,050 to $1,150 per ounce. However, platinum’s market price can be more volatile because it is strongly influenced by industrial demand, especially from the automotive sector, where cyclical shifts can lead to rapid changes in pricing. Meanwhile, silver’s production costs are significantly lower—ranging from $11.76 to $20.40 per ounce—while its market price typically trades in the $20–$25 per ounce range, making its margins particularly sensitive to industrial cycles.
4.2 Production Scale Differences
The scale of production also varies considerably among these precious metals. In the gold sector, production volumes can range from smaller operations producing around 300,000 ounces per year to giants like Newmont Corporation, which produced up to 5.5 million ounces in 2023. This wide range reflects differences in resource availability, mine maturity, and operational efficiency.
Silver producers generally operate at a larger scale. Leading companies such as Fresnillo have reported production volumes exceeding 56 million ounces annually, while other silver mines produce between 14 million and 56 million ounces each year. This high output underscores silver’s abundance and extensive industrial use.
For platinum, the production scale is comparatively lower. Major producers like Anglo American Platinum produce around 1.75 million ounces per year, with other key players such as Sibanye Stillwater, Impala Platinum, and Northam Platinum operating in the range of approximately 500,000 to 2.1 million ounces annually. These figures highlight the relative rarity and more geographically concentrated deposits of platinum, which, combined with its specific market dynamics, shape its overall production profile.
5. Factors Influencing Costs
Production costs in mining are influenced by a complex interplay of operational efficiency, geography, commodity market dynamics, environmental and social governance (ESG), and macroeconomic and political factors. For instance, our data indicate that gold’s sustainable costs can range from approximately $1,179 to $1,538 per ounce, underscoring the impact these factors have on cost variability across different regions and operational strategies.
Operational efficiency plays a central role. Investments in automation, mechanization, and innovative extraction techniques can reduce labor costs and improve recovery rates. In some cases, such improvements have been known to lower per-ounce production costs by up to 10%, enabling large-scale operators to better absorb overheads and maximize economies of scale.
Geography and infrastructure also significantly affect costs. Mines in stable jurisdictions like Canada and the USA often operate at lower costs—illustrated by gold producers in these regions reporting costs between $1,179 and $1,335 per ounce—whereas operations in more challenging regions, such as certain South African mines, may incur costs as high as $1,538 per ounce due to issues like aging infrastructure and unreliable power supplies.
Commodity market dynamics add another layer of complexity. Price volatility can dramatically influence profitability; for example, gold prices around $1,800–$1,900 per ounce provide a buffer for high-cost producers, while fluctuating market conditions affect byproduct credits that can lower reported costs—seen in silver (ranging from $11.76 to $20.40 per ounce) and platinum (around $1,050–$1,150 per ounce).
Meanwhile, ESG requirements compel companies to invest an additional 5–15% in cleaner technologies and community initiatives, raising upfront capital expenditures. Macroeconomic factors, such as currency fluctuations, can further shift effective costs by 10–20% when converting local expenses into U.S. dollars. Together, these factors create a dynamic and challenging cost environment that mining companies must adeptly manage to sustain profitability.
Conclusion
In 2023, the cost landscapes for gold, silver, and platinum reflected not only geological variations but also shifting market dynamics and local conditions. Gold miners operated under typically higher costs, although persistently strong gold prices near $1,800–$1,900 per ounce provided some safeguard. Standouts include AngloGold Ashanti, which remained profitable despite having one of the highest costs. Meanwhile, Newmont underscored that even top-tier producers can post losses if capital expenses run high or operational disruptions occur.
Silver presented a lower nominal cost range, but its profitability often swung with industrial demand. Fresnillo’s high-volume strategy resulted in robust profits, illustrating how sheer scale can overshadow elevated costs per ounce. By contrast, other producers struggled when overheads and broader market factors compressed margins.
For platinum, regional concentration in South Africa and Russia brought unique risks. Sibanye Stillwater reported a major loss despite low reported costs, underscoring the significance of labor, power issues, and corporate finance decisions. MMC Norilsk Nickel thrived on a diversified portfolio, mitigating reliance on platinum’s occasional price swings.
Across these metals, the persistent themes remain: the necessity of cost discipline, the impact of local infrastructure and energy reliability, and commodity prices driven by global supply-demand imbalances. In an environment marked by geopolitical tensions and economic uncertainty, miners that manage their operational challenges and swiftly adapt to market shifts are more likely to secure sustainable profitability—whether their focus is on gold, silver, or platinum.
Date = 5th February 2025, all sources are from annual financial reports 2023 of the companies listed in this article.
Source: https://bunker-group.com/en/blog/platinum-production-cost


