The US yield curve has just reached the limits of inversion. Is this a harbinger of a financial crisis?
US Yield Treasury Curve Inversion
Recently, the US Treasury yield curve reached new extremes of inversion. The main idea of the article is to investigate if the financial crisis arrives when the yield curve is getting back to normal.
In the first chapter, we will show that the inverted yield curve is a harbinger of a financial crisis.
In the second chapter, we will show that a negative real interest rate influences to the growth of the stock market.
In the third chapter, we will show that earnings per share is one of the main drivers of the stock market.
1. Inverted Yield Curve Indicates the Recession
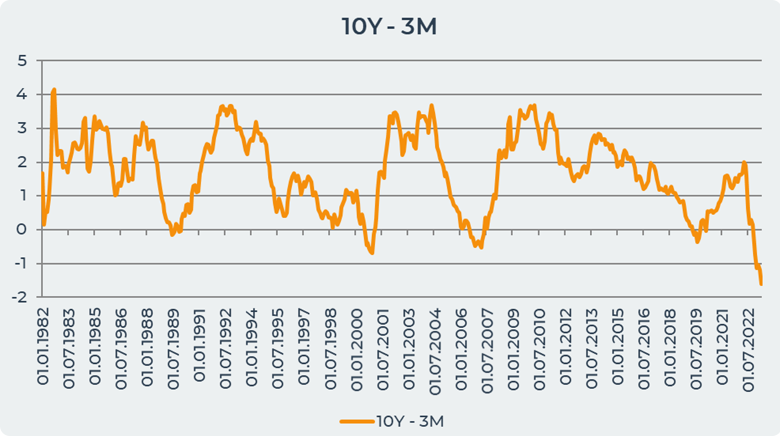
An inverted yield curve occurs when long-term interest rates are lower than short-term interest rates. This means that income decreases the further the maturity date is. The graph below shows that there were 3 main periods when the yield curve fell below 0. This is the period in 1989-1990 ; in October-December 2000 ; in 2007 ; in 2019 and in 2022-2023.

In 1989-1990, the yield curve became zero for the first time. During this period, the value of S&P 500 shares increased by 14% from 294 US$ Dollars per share to 338 US$ Dollars per share. However, unemployment decreased from 6% in 1987 to 5.5% in 1990. After the yield curve returned to normal, a financial crisis occurred. In 1990, the US entered a post-Gulf War 8 month recession that lasted until March 1991. Unemployment rose to 7.8% in 1992, and interest rates fell from 9% to 4%. During this time, the stock market declined until the end of 1990, but began to rise in 1991.
The second yield curve inversion occurred in October-December 2000. During this period, unemployment fell from 4.2% to 3.8% in 2000. Stocks rose 22% to 1328 US$ Dollars per share in the S&P 500. The Fed raised its rate from 5.75% to 6.5% in 2000. However, a financial crisis occurred in 2001-2003. Huge sums of money poured into increasingly less viable dot-com investments, leading to the inevitable stock market crash. During this period, the Fed lowered its interest rates from 4% to 1%. The stock market crash had an impact on the real economy, causing GDP to fall and unemployment to rise during an eight-month recession. The terrorist attacks of September 11 only exacerbated the problems in the economy.
In 2006, the yield curve began to decline and reached a negative value in 2007. In 2006, the Fed began to raise its interest rates, motivating them with the threat of a bubble in the real estate market. The value of shares during this period increased from 1237 US$ Dollars to 1455 US$ Dollars. However, in 2007, when the yield curve returned to normal, the great recession and the collapse of the real estate market began. The unemployment rate began to rise steadily and reached 10% in October 2009. The Fed began to lower its interest rates due to the worsening economy. The Great Recession officially began in December 2007 and lasted until June 2009. Moreover, the Fed began implementing a new type of monetary policy known as "effectively zero". This occurs when the central bank lowers its interest rates to 0% or close to 0%. Unable to keep cutting, the Fed began buying trillions of dollars in bonds to stimulate the economy and get Americans back to work. In the period 2007-2009, the value of shares decreased by 100%.
At the end of 2018, the yield curve fell again to the 0% yield level and remained there until the beginning of 2020. The Fed began to raise its interest rates and the unemployment rate decreased by 0.3%. In March 2020, the yield curve began to return to its usual direction. However, the stock market began to collapse and lost 20% in just one month in March 2020. During this period, the Fed began to lower its interest rates to 0%. In 2019, there was a trade conflict between the USA and China. The Fed feared that this could hurt the economy and raise unemployment. In 2020, there was a fight against the Covid19 pandemic, which caused a sharp increase in unemployment to 14%. However, when the Fed lowered its rates to 0.25%, the economy began to grow.
The most recent example of an inverted yield curve is happening right now. As the chart above shows, this is the most negative value of the yield curve in history. The yield curve began to decline in August 2022 and continues its decline to date. However, the stock market typically shows its growth of 10% during this period. Unemployment is falling and the Fed is raising rates. According to the comments of investors, we are facing a major financial crisis due to the huge accumulation of debts. As we saw above, the inverted yield curve is an indicator of financial crises.
2. Negative Real Interest Rates Push Up the Stock Market
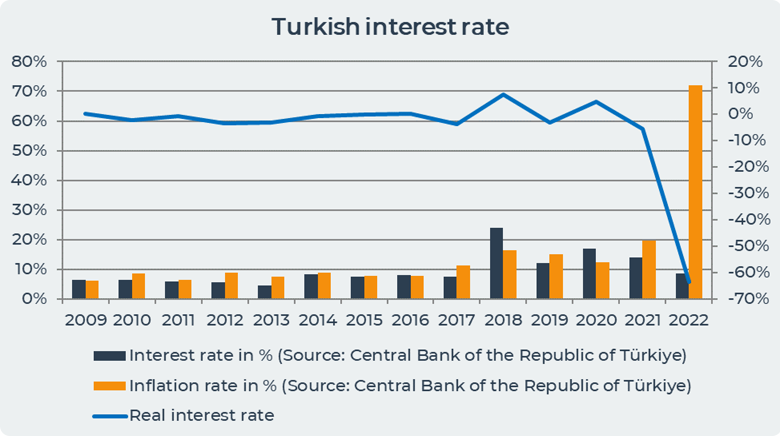
A real negative interest rate occurs when inflation exceeds the central bank's interest rate. We will take the example of Turkey to demonstrate that a real negative interest rate affects the growth of the stock market.

The graph above shows that the real negative rate in Turkey arose in 2012-2013. During this period, there was a stock market rally, which caused an increase in domestic currency prices on the BIST 100, the main indicator of the Turkish stock exchange.
In 2017 and 2019, there is a boom in the stock market in Turkey again, while the real negative interest rate is -4% and -3%. During this period, there is a sharp increase in the prices of BIST 100 by 30%.
In 2022, is the largest negative indicator of the real negative rate and is -63% due to inflation of 72%. In 2022, the value of shares increases by 400% when inflation rises sharply to 80%. At this moment, the real negative rate is very negative and this affects the growth of earnings per share. Although in 2022, some companies have a decrease in their earnings per share. Their value has steadily increased significantly following other companies.
3. Earnings Per Share Drives Stock Market
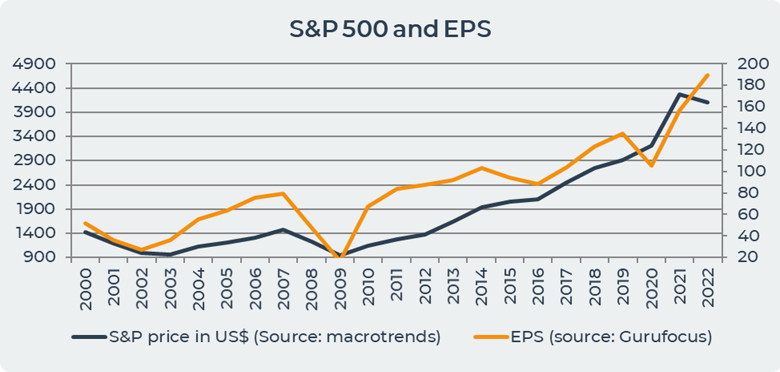
Earnings per share is the portion of a company's income available to shareholders and allocated to each common share outstanding. Earnings per share is equal to the difference between net income and preferred dividends divided by the average number of common shares outstanding. Earnings per share shows the stability of earnings as well as the trend of earnings compared over different quarters or years. The graph below shows a high correlation of 91% between earnings per share and share price over the past 20 years in the S&P 500.

The graph above shows that earnings per share and share price move in unison with each other. During the financial crisis in 2001-2002, earnings per share decreased by 25%, which led to a 24% drop in the share price from $1,193 in 2001 to $965 in 2003. During the Great Recession of 2007-2009, earnings per share decreased by 490% from 79 in 2007 to 16 in 2009, and the share price fell by 55%. Another reduction in earnings per share occurred in 2014-2016 by 15% and in 2019-2020 by 27% during the Covid19 pandemic. In all these periods, stocks have always followed the trend of earnings per share. Which means that during the crisis, companies were not profitable enough to pay out more money to their shareholders.
Conclusion
The inverted yield curve in the US is a good indicator of the coming financial crisis. This means that short-term debt instruments have higher yields than long-term debt instruments, signaling bond investors' expectations of lower long-term interest rates, typically associated with recessions. The inverted yield curve occurred before the periods of the biggest financial crises in 1990, 2001, 2007 and 2019. At the moment, we have the most negative inverted yield curve in history, which is an indicator of the coming crisis that investors are talking about. However, during an inverted yield curve, the stock market rises. Another factor in stock market growth is negative real interest rates resulting from rampant inflation and significantly lower interest rates. Another factor that affects the growth of the share price is the income per share, which shows a high level of correlation with the share price in the last 20 years.
Date= 27th June 2023, Gold price – 1927.50$, Silver price – 23.16$, Platinum price – 939$, Oil price – 67.80$


